README
English | 简体中文
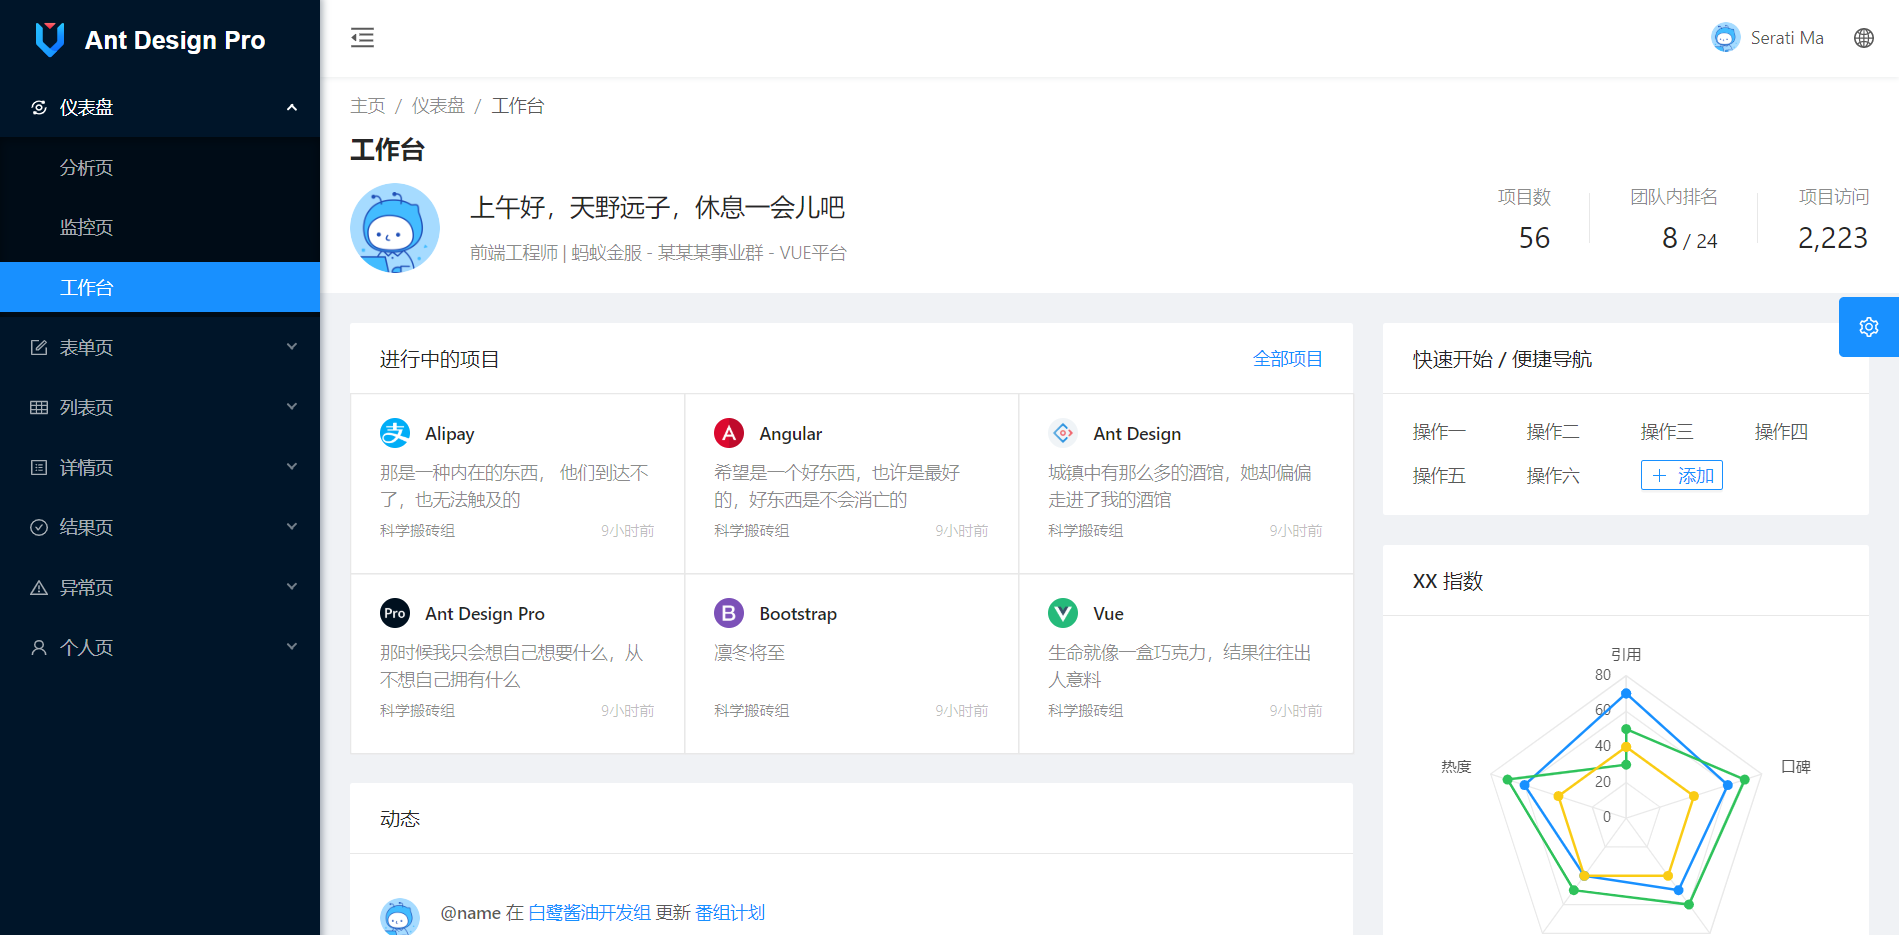
Ant Design Vue Pro for Vue 2
An out-of-box UI solution for enterprise applications as a Vue boilerplate. based on Ant Design of Vue
If you are looking for the Vue 3 version, please visit [Ant Design Vue Pro for Vue 3](https://store.antdv.com/items/admin-pro)


- Preview: https://preview.pro.antdv.com
- Home Page: https://pro.antdv.com
- Documentation: https://pro.antdv.com/docs/getting-started
- ChangeLog: https://pro.antdv.com/docs/changelog
- FAQ: https://pro.antdv.com/docs/faq
- Vue3 ProLayout: https://github.com/vueComponent/pro-layout
Overview